
Economia Politica https://doi.org/10.1007/s40888-023-00311-0
Imaduddin Ahmed · Priti Parikh · Parfait Munezero · Graham Sianjase · D’Maris Coffman
Abstract
As global average temperatures rise, so does the frequency and intensity of El Niño-induced droughts, which in turn threaten the reliability of hydropower. 1.4 billion people live in countries where hydropower constitutes more than a quarter of the electricity production and which have experienced El Niño droughts, meaning many more power outages can be expected around the world. Little research has been conducted on the impact of power outages on mental health. This study takes Zambia as its case study to examine the impact that El Niño droughts have had on the lives of householders connected to a highly hydropower-dependant electricity grid, and includes the impact it has had on their physical and self-reported mental health. Using 54 online responses to a survey, we found that the greatest impacts of outages spoiled food, compromised entertainment, compromised ability to work and limitation in cooking options. More than a fifth of respondents reported experiencing self-reported depression to a major degree or all of the time due to power outages, with individuals writing their own responses that they felt debilitated, experienced reduced communication and reduced activities, and stress. Using Bayesian inference, we found that changes in sleeping patterns arising from power outages was a statistically significant predictor of self-reported depression. 63% of surveyed households were willing to pay approximately USD 0.10/kWh as of the end of 2019, about double the tariff that they did, to ensure reliable electricity supply. Household income was a statistically significant predictor of willingness to pay more.
1 Introduction
As global average temperatures rise, so too do the frequency and intensity of El Niño Southern Oscillation-induced droughts (Wang et al., 2017), which in turn threaten the reliability of hydropower (Ahmed et al., 2020). 1.4 billion people live in countries where hydropower constitutes more than a quarter of the electricity production and which have experienced El Niño droughts, meaning many more power outages can be expected around the world (Ahmed, 2021a). Little research has been conducted on the impact of power outages on mental health. This study takes Zambia as its case study to examine the impact that El Niño droughts have had on the lives of people whose households are connected to the electricity grid, and includes the impact it has had on their physical and mental health.
Due to a combination of (a) El Niño droughts in 2015, 2016 and 2019 and (b) an almost complete dependance on hydropower, Zambian grid electricity consumers experienced severe power outages in three of the past six years. Zambia’s largest dam reservoir capacity fell to 9% in December 2019 (Malunga, 2019; Zambezi River Authority, 2019) and outages lasted up to 15 h a day (Zesco, 2019).
The causes of power outages within human control included path dependence and institutional inertia to react to warnings that Zambia’s system of electricity provision must diversify power generation away from almost complete depedance on hydropower due to increased evaporation, reduced annual streamflows and an increased intensity of droughts caused by climate change (Ahmed, 2021b) – some warnings as early as 2001 and 2002 – (Beilfuss, 2012; Harrison & Whittington, 2002; IPCC, 2001, Table 10–1; Spalding-Fecher, 2012). Another cause was very low tariffs that precluded investment into additional power generation infrastructure or credible commitments to independent power producers or trading partners within the Southern African Power Pool (Ahmed, 2021a; Haria & Ahmed, 2020).
In addition, therefore, to studying the impact of and coping mechanisms of these severe power outages on Zambian households, we aimed to learn whether households would be willing to pay what was reckoned to be a system sustainable tariff, and what the predictors of willingness to pay were.
Zambia is an interesting case not only because of the approximately 5.6 million grid-connected electricity consumers at the time of our survey, but because it is a mine canary for at least 32 developing countries with a combined population of 1.4 billion people that are more than 25% dependent on hydropower for their grid electricity generation and which have experienced El Niño droughts (Ahmed, 2021a).
In the next section we review the literature on the impact of power outages. We identify gaps and define our research objectives in Sect. 2. In Sect. 3, we delineate our methodology for investigation. In Sect. 4 we present our results and discuss them. We provide our conclusions and recommendations in Sect. 5.
2 Literature review
We categorise the literature covering power outages at the household level into the following themes: literature discussing where power outages are most likely to occur; the consequences of outages; adaptation strategies, and in the case of diesel power generation, its adverse impacts; avoiding power outages in the first place, including willingness to pay higher electricity tariffs to avoid outages; customers’ preference for when to avoid outages; and the consequences of higher electricity tariffs. We accordingly discuss the literature by theme.
2.1 Power outages not distributed at random
In acknowledging limitations to his empirical findings, Meles suggests that power outages are unlikely to be distributed randomly: households with more hours of outages are likely to be systematically different from those with fewer hours because they belong to neighbourhoods with less political and economic influence (Meles, 2020). Bajo-Buenestado (2021) studied the geography of electricity supply reliability, and found that neighbourhoods across Kenya which experience power outages more frequently are likely to have a higher proportion of houses without electricity. Unlike an earlier study that similarly found that an increase in electricity reliability is associated with an increase in electricity connections (Millien, 2017), Bajo-Buenestado controls for household-level and neighbourhood-level variables that could bias estimates.
2.2 Consequences
The severity of impacts can be predicted by how frequently and predictably outages occur: on the one hand, the more frequently or predictably they occur, the better prepared people are for them (Abi Ghanem, 2018; Wethal, 2020), while on the other, more frequent outages can also exacerbate the effects. A study in Accra found that the impact of outages could be predicted by household characteristics. Nduhuura et al. (2021) found that socioeconomic disadvantage (annual income, employment status, living in a large family setting as well as frequency of electricity outages) were significantly correlated with reporting certain outage impacts. Other predictors of outage impacts include the income, employment status and frequency of electricity outages and household size according to one study, and similarly, sociodemographic factors, previous experience, risk perception, and access to resources according to another (Esmalian et al., 2021; Nduhuura et al., 2021).
Power outages seem to have an adverse effect on economic activity and education, physical health through physical factors and on mental health through stress factors, including loss of security, poor physical health, loss of therapeutic activities and perceived challenges to economic activity and education.
Accidental deaths increased by 122%, non-accidental deaths increased by 25% following the New York outages of 2003 (Anderson & Bell, 2012). Lin et al. (2011) found that mortality and respiratory hospital admissions increased significantly, speculating that the surge in respiratory mortality may have been caused by the outages of air conditioners, resulting in poor air quality, exertion and psychological stress.
Studying the same outages Marx et al. (2006) found that the power outages were associated with diarrhoeal illnesses. The link between the two, they posited, was the disruption of refrigeration and ensuing spoilage of meat and seafood. Besides diarrhoea, the most common symptoms reported by their study cohort were cramps, loss of appetite, nausea, vomiting, headaches, and fever. Increase in incidence of diarrhoea could also result from compromised water quality, speculate Dominianni et al. (2018), caused by the outage of power to water pumps. Using results from microbiological water tests for piped water in Yemen, Klasen et al. (2012) provide a possible rationale for why water outages caused by power outages would cause increased diarrhoea: pollution builds up in pipes when water supply is interrupted.
Four-fifths of respondents perceived power outages as a major challenge for security of life and property in the Niger Delta (Amadi, 2015). Similar proportions of respondents perceived outages as a major challenge for economic growth, health and education (Amadi, 2015). Loss of security was starkly seen during a 25 h blackout in New York in 1977 at the beginning of a heatwave. A “crime rampage” occurred, involving hundreds of incidents of fires and vandalisation, looting and two deaths (Jane Corwin & Miles, 1978; Maxouris, 2019). In the Zambian manufacturing context, extra costs of ensuring security were a frequently cited cost by respondents (Ahmed et al., 2019; Ahmed, 2021a).
Based on a scan of healthcare websites and a newspaper article (Athrosurface, 2015; Eckert, 2021; Florida Medical Clinic, 2018), Mango et al. assert that mental illnesses can be exacerbated as a result of electricity power outages (Mango et al., 2021). Keeping cool in hot weather is not just a matter of comfort, but a matter of managing the symptoms of bipolar disorder, including suicidal thoughts according to the details given in one case; more generally analysis found emergency response calls relating to psychiatric conditions increased nearly 40% in Baltimore in the summer of 2018, when the heat index spiked above 103 (Eckert, 2021). High temperatures put people with chronic behavioural health conditions at greater risk (Eckert, 2021).
Another mechanism by which power outages can affect mental health through lack of temperature regulation is that patients suffering from arthritis and chronic joint pain suffer when exposed to extreme temperatures (Athrosurface, 2015); chronic pain is highly correlated with depression (Florida Medical Clinic, 2018).
Further, for those using electric cookstoves, power outages can limit cooking options. Cooking has found to be therapeutic – Farmer et al. performed a systematic review and found that cooking interventions yielded positive influences on socialisation, self-esteem, quality of life and affect (Farmer et al., 2018). Limited cooking options could also conceivably result in disturbed eating patterns and result in malnutrition; recent studies of the elderly in Bangladesh and Greece have found an association between geriatric malnourishment and depression (Alam et al., 2021; Mantzorou et al., 2020). Replacing electricity with cooking with on-site combustion, including cooking with charcoal, can cause further health problems through an increase in household air pollution. Researchers in Ghana found that a coalpot charcoal stove would emit 0.02 mg PM2.5/kJ and 4.14 mg of carbon monoxide/kJ of energy. This carbon monoxide output is higher than World Health Organization air quality guidelines (Obeng et al., 2017). Household air pollution in general is associated with pulmonary diseases, lung cance, cardiovascular diseases and reduce quality of life (Lee et al., 2020).
Responding to power outages with backup diesel or petrol generators also has a negative impact on health. Oguntoke and Adeyemi found in Nigeria that carbon monoxide levels for 1–1.5kVA backup generators at source were approximately 400 times higher than safe maximum human exposure levels. They found in general that low-capacity generators (i.e. those most likely to be found outside homes) emitted the highest levels of carbon monoxide. Only at 10 m distance did levels of carbon monoxide fall within safe limits (Oguntoke & Adeyemi, 2017). Two-thirds of respondents reported frequent nasal congestion, 33% reported frequent coughing, 24% reported frequent headaches. Oguntoke and Adeyemi were not however able to state unequivocally that these were associated with generator use.
To the extent that people change their sleeping time to adapt to power outages (or power outages affect their sleep patterns), this may also have an effect on mental wellness, since manipulations in sleep–wake cycles – whether of duration or timing – have ‘profound and rapid effects on depressed mood’ (Wirz-Justice & Van Den Hoofdakker, 1999). From a sample of 4175 youths, Roberts and Duong (2014) found that sleep deprivation predicted measures of depression. Their data suggest reduced quantity of sleep increases risk for major depression.
2.3 Adaptation to outages/mitigation strategies
Some common households strategies to cope with lengthy power outages include: using wood and gas-driven stoves for heating; candles, hand and head-torches, LED lights and kerosene lamps for lighting; fetching water manually from natural water sources, wells or buying water when pumped water becomes unavailable; and using back-up generation (Wethal, 2020) as well as uninterrupted power supply. Batteries and uninterrtible power supply (UPS) equipment allow households to dispatch power when households experience power outages from the power grid (Carlsson et al., 2021; Tao et al., 2021). Though not dispatchable on demand, household or mini-grid solar PV can also help build resilence (Hotaling et al., 2021; Lan et al., 2021). With planned outages at the same time of the day every day Beirut, people are able to organise their routines around the outages, such as pulling out the power for the refrigerator when their backup generator is on, so that the water heater can be used for showers (Abi Ghanem, 2018).
2.4 Avoiding power outages
One means of avoiding power outages is to reduce power demand. The distribution of energy efficient compact fluorescent lamps to reduce peak loads on electrical systems in the Kyrgyz Republic was found to decrease transformer overloads and increase electricity reliability (Carranza & Meeks, 2021). This is not, however, a coping mechanism that will allow one household to prevent its power outages, but one that requires coordination from among a multitude of users.
Another means of preventing power outages is to pay a system sustainable tariff that enables the power utility to make the additional investments required in infrastructure to prevent power outages, or to be able to make credible commitments to other parties that it will pay them for electricity sold.
The bulk of applicable literature used a stated preference approach, preferred over asking households to specify their costs of outages and quantifying investments aimed at mitigating power outages because it considers all welfare effects by including non-market effects, such as not being able to watch a favourite TV programme (Carlsson & Martinsson, 2007). Through our literature review, relevant factors we found to be predictors of willingness to pay a higher system-sustainable tariff were:
- Age. Both in Kenyan (Kisumu County) and in an Ethiopian (Addis Ababa) context Abdullah and Marial (2010) and Meles (2020) found that older people were less likely to pay more. Through focus-group discussions, Abdullah and Marial uncovered a possible reason – older participants had a decline in confidence in government. Similarly, Meles found that respondents who believed electricity services would improve within five years had a higher willingness to pay (WTP). Abdullah and Marial used a choice experiment valuation, a subset of the stated preference method, whereby they provided respondents with several choices for additional amounts to be paid per month for reliable electricity. This method had been used by Carlsson and Martinsson (2008), after whom they had also assumed a linear random utility function of income, costs and other variables. To the results that they garnered from their survey, they applied a mixed logit estimation to identify various socioeconomic and demographic characteristics. Similarly, Meles used a stated preference method to elicit the value of uninterrupted electricity supply. Unlike Abdullah and Marial, Meles then processed the data applying the generalised propensity score method proposed by Hirano and Imbens (2004), which in turn is an extension of Rosenbaum and Rubin’s (1983) binary treatment propensity score method in a continuous treatment setting. The reason for this divergence was to address potential endogeneity and selection biases. The main assumption was that hours of power outages at households were random, conditional on a set of observable covariates. Unlike Abdullah and Mariel, Meles used a random utility model to describe households’ decision regarding WTP for a better quality of electricity services, with income and cost not built as a central feature within the model.
- Length of time spent in an area. Abdullah and Mariel (2010) found those resident in an area for longer were less likely to pay more.
- Whether a respondent was unemployed. Abdullah and Mariel (2010) found that the unemployed were less likely to pay more.
- Whether a respondent was a bank account holder. Abdullah and Mariel (2010) found that those with bank accounts were likely to pay more.
- Total energy electricity demand and reliance, with household size, electricity use and time series as proxies. Abdullah and Mariel (2010) found that respondents with larger households and hence greater demand for electricity, as well as those who engaged in farming, were likely to pay more. In a Swedish context, Carlsson et al. (2021) found that over time from 2004 to 2017 (using two stated preference studies, the proportion of households stating zero willingness to pay to avoid power outages decreased significantly. They conjectured that this was due to the greater use and reliance of electricity as households had acquired more electronic appliances and devices such as laptops, smartphones and electric vehicles.
- Whether power outages were planned or unplanned. Carlsson and Martinsson (2007) found that WTP was significantly higher for unplanned outages. They used a contingent valuation survey, whereby respondents were asked to state their WTP for avoiding nine different types of power outage. To the data collected, they applied a random parameter Tobit model since there was a cross-sectional heterogeneity and a proportion of zero WTP responses.
- The duration of power outages experienced. In both Swedish and South African contexts, Carlsson and Martinsson (2007) and Nkosi and Dikgang (2018) respectively found that respondents’ willingness to pay depended positively on the duration of power outages. Like Carlsson and Martinsson, Nkosi and Dikgang used a contingent valuation survey and subjected respondents to several power outage scenarios to state their WTP. They too applied a random parameter Tobit model to account for both zero WTP and cross-sectional heterogeneity.
- Whether the respondent was able to self-generate power or share self-generation. In the Nigerian context, from a 2013 survey conducted in Lagos and Osun states, Oseni (2017) found that on average, households with backup petrol or diesel self-generators had a higher willingness to pay than those without, even though self-generation reduced the negative welfare losses of unreliability. Oseni infers that the reason was because the marginal cost of self-generation was greater than the higher figure of USD 0.15–0.16/kWh they were willing to pay, and that households with generators have a higher disposable income than households without. Oseni found significant positive predictors in a probit model of whether a household invested in a generator to be the respondent’s reported income, the number of household appliances in the house and whether the respondent had a home-based business, as well as confidence about future improvements (which in a Kenyan context, through focus-group discussions, Abdullah and Marial (2010) found deteriorated with age). Negative significant predictors were whether the household was a shared one, a greater number of household occupants (in contrast to Abdullah and Mariel finding more people in a household being a predictor of a greater WTP for reliable electricity supplied from the grid), and whether the respondent was based in the state of Osun as opposed to the state of Lagos. In an Ethiopian context, In Addis Ababa, (Meles, 2020). Meles estimated that households spend on average USD 0.06/h to counter outages through candle lighting, cooking with charcoal and use of standby backup generators (Meles, 2020). An increase in the electricity tariff changed household behaviour and consumption patterns in order to control cost, and uncertainty heightened household vulnerability (Tesfamichael et al., 2021).
- The respondent’s confidence in future improvements (Meles, 2020; Oseni, 2017)
- Household income. Meles (2020) found household income was positively associated with willingness to pay for improved electricity supply on average a 10% increase in monthly income would result in a 1.5–1.7% increase in WTP.
2.5 Preference for power outages during off-peak hours
In Belgium, households preferred for power outages to occur in off-peak periods, and were willing to pay a premium of 30 euros a year for this (Pepermans, 2011). In northwest England, households were willing to pay £5.29 to avoid having power outages in peak periods, £7.37 to have outages during the week rather than the weekend or bank holiday, and £31.37 to avoid power outages in winter (Morrissey et al., 2018). Households are also willing to pay more to avoid outages depending on the length of the power outage. In Ethiopia, individuals preferred outages in the morning, and households were WTP more for a day prior notification than for a week prior notification (Meles et al., 2021).
3 Methods
We aimed to learn the impact and coping mechanisms of power outages on Zambian households, and the WTP for a system sustainable tariff.
For coping mechanisms, we resorted mainly to descriptive statistics.
For respondents’ WTP, like the preceding literature (Abdullah & Mariel, 2010; Carlsson & Martinsson, 2007; Meles, 2020; Nkosi & Dikgang, 2018), we sought to use the stated preference valuation method to determine people’s WTP, used a choice experiment valuation, whereby respondents were offered a choice of different tariffs they would be willing to pay in order to stop power outages. Unlike these previous studies, we neither used logit estimations or Tobit models for analysing the data given the limited sampling achieved (see below). To deal with the issue of a small sample, we resorted to Bayesian inference (see below). We sought to confirm the impact of salary band, age and number of people in a household. Salary band took into account employment status, identified by Carlsson and Martinsoon (2008) and Abdullah and Mariel (2010) as a significant factor in people’s utility functions, and seemed to be an omitted variable in Oseni’s analysis that ascribed greater willingness to pay when a household had its own generator versus when it shared a generator. Since our survey would be limited to people with internet connections and was also limited in size, we did not think we would find households without bank accounts, another predictor identified by Abdullah and Mariel. We did not test for confidence in future developments as separate from age.
Moving beyond the existing literature, we sought to understand whether power outages and any intermediate effects of power outages may be associated with self-reported depression. One of the questions we asked respondents directly was whether they experienced depression as a result of power outages. We then wanted to test whether there was an association between perceived depression associated with power outages, and potential connecting factors. A hypothesis laid out by Mango et al. was that an inability to keep cool in hot weather might exacerbate pain among people suffering from arthritis and chronic joint pain and that chronic physical pain is highly correlated with depression; and that an inability to keep cool in hot weather might also exacerbate pre-existing mental illnesses (Mango et al., 2021). Literature connecting malnutrition with depression and pointing to the therapeutic benefits of cooking also motivated us to test whether limiting cooking options might be a significant connecting factor between power outages and depression. We also wanted to test whether physical sickness attributed to the power outages and change in sleep patterns, were associated with self-reported depression, as links have been made in the literature reviewed above. Again, to deal with the issue of a small sample, we resorted to Bayesian inference (see below).
We sought to collect primary data from individuals from different households in Zambia using a online questionnaire. The survey was designed to:
- (1)Qualify the characteristics of households (age of respondent, number of people in the household, whether the respondent pays for the electricity themselves, and the household income);
- (2)Learn the ways in which power outages impacted households, and their relative frequency;
- (3)Learn households’ impact mitigation strategies;
- (4)Learn households’ maximum WTP for more reliable energy, learn the predictors of WTP more, and learn the anticipated behaviour changes that would result from higher tariffs.
3.1 Sampling
The sampling universe was Zambians over the age of 17 with internet and grid power. As of 2018, Zambia had a population of 16.9 million people across 3.5 million households, 33% with grid electricity access and 18% with internet access (ZICTA & CSO, 2018), i.e. 630,000 households. We assumed that all who were able to access our survey had smartphones or more sophisticated electronic devices at home, read English and were therefore among the population who both had electricity at home and internet access.
We collected data after obtaining ethical approval from University College London (ethics identification number 11769/001), using convenience snowball sampling (i.e. it was not designed to be geographically or socioeconomically representative), sharing the survey using social media tools with first-degree contacts, who then forwarded the voluntary survey to their contacts. We had hoped to collect a sample of at least 100 respondents, but we stopped collecting data on 1st January 2020 because the energy regulator changed the tariff, thus impacting the survey. We achieved a sample size of 54 individuals from different households in different parts of Zambia in December 2019. 128 surveys had been initiated from 128 distinct Internet Protocol addresses, but 74 respondents did not provide the consents required and so were unable to proceed to the questionnaire.
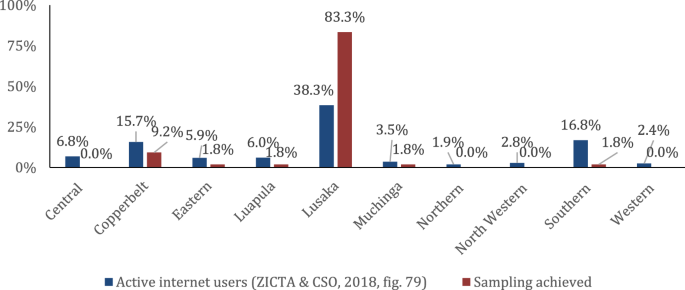
The sampling achieved was not representative of the number of active internet users spread across Zambia: Lusaka Province was overrepresented by 2.2× in terms of active users, resulting in the underrepresentation of all other provinces. We did not find data on household internet data consumption per province. This data might show that our sample was not in fact so over-weighted for Lusaka Province, which is home to the capital and largest city of Zambia and so likely to have the greatest population with disposable income for internet data (Fig. 1).
Each respondent used a distinct internet protocol address. Between this and the fact that no two set of responses was alike, it is likely that each response represented a distinct household.
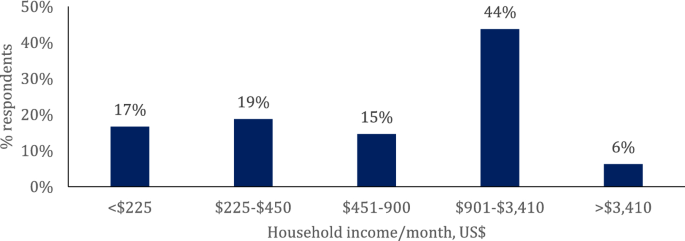
Respondents ranged in age between 23 and 53, with a mean age of 33 and standard deviation of seven years. 96% of respondents paid for electricity themselves. The willingness to pay results for people who were not responsible for paying electricity bills themselves were cleaned out, but their experiences for power outages were retained. The distribution of incomes of the sample is as below in Fig. 2. The modal representation was of Zambia’s relatively affluent middle class of c.40,000 households (Zambia Institute for Policy Analysis & Research, 2013, p. 10; World Bank, 2020). Those in the lowest income bracket could have been students.
3.2 Models
Given the relatively few observations, we needed to make several adjustments to our data and our econometric modelling. We could not use ordinal logistic regressions as had been used in the literature and as we had intended. With respect to the data, to increase the density of results per category of score, we made the results 0–4 coarser by condensing scores of 0 into a score of 0 and condensing scores of 1–4 into a score of 1.
3.2.1 Logistic regression models
The binary responses for both models (with WTP as the dependent variable in the first analysis and self-reported depression in the second analysis) allow us to fit logistic regression models to the data. This class of models express the probability p(y = 1|x) of a response y = 1 given a set of covariates X as:
p(y=1|x)=11+e−xβ�(�=1|�)=11+�−��
(1)
where β is a vector of regression coefficients. Given y = (y1,…, yn) responses for all n survey participants, and their covariate profiles X = [× 1⊤,…, xn⊤], the probabilistic model (1) leads to the likelihood function
f(y|X,β)=∏ni=1(exiβ1+exiβ)yi(11+exiβ)1−yi�(�|�,�)=∏�=1�(����1+����)��(11+����)1−��
(2)
where β is a vector of regression coefficients (including the intercept), xi and yi are respectively the covariate vector and the response values for the ith individual.
The regression coefficients are the only parameters in the model (2) to be learned. Standard inference methods based on the maximum likelihood estimate (MLE) require large sample size to avoid overfitting and biased estimates; this is a challenge in our case since our sample size is very small. To alleviate these issues, we opted for the alternative Bayesian inference methodology.
3.2.2 Bayesian inference
The Bayesian inference methodology allowed us to incorporate prior information about the parameter in inference. This is usually gathered from expert knowledge or results from previous similar analyses (if available). Let p(β) be the prior distribution built from the available prior information, the Bayesian paradigm updates the prior, with evidence from data, into the posterior distribution p(β|y, X) via the Bayes theorem:
p(β|y,x)∝f(y|x,β)p(β).�(�|�,�)∝�(�|�,�)�(�).
(3)
The posterior is the core element in Bayesian inference. All conclusions about the parameter are based on probabilistic interpretations of the posterior distribution. In practice, such conclusions are made based on posterior summaries such as the mean, median or standard deviations and the posterior intervals (the most used are 95% credible intervals).
3.2.2.1 Prior elicitation
There are different methods of eliciting the prior distribution. In cases where there is enough data, we may use a flat or uniform prior; in such cases the posterior is dominated by likelihood and hence the results will be similar to MLE estimates. In the cases when we don’t have enough data, it is crucial to design an informative prior. There are different ways of eliciting informative priors for regression coefficients in logistic regression models. One may incorporate information via measurable quantities of the response variable (Bedrick et al., 1996) such as the probabilities in (1). If some data from previous studies similar to the current study are available, Chen et al. (1999) proposed a method of using these data to constructing informative priors. Alternatively, one may select the distribution family of the prior and add minimal information such as the location, scale, or degree of freedom. This type of prior is well known as the weakly informative prior. This approach is useful in situations when we don’t have historical data but we have some idea about what is reasonable given our background knowledge of the study. In this perspective, Gelman et al. (2008) suggested independent Cauchy distributions for the regression coefficients centred at 0 and scale 2.5 (except for the intercept whose scale is set to 10), and Asanya et al. (2023) showed through simulations that these priors (with slight modifications) are robust in the presence of outliers and for small sample sizes. We, therefore, applied the prior design of Gelman et al. (2008). The intercept is assigned a Cauchy distribution with centre 0 and scale 10, while the rest of the regression coefficients are assigned independently a Cauchy distribution with centre 0 and scale 2.5. For each specific model presented, we performed a sensitivity analysis and we observed that our posterior estimations were robust to changes in the prior scale.
3.2.2.2 Posterior computation
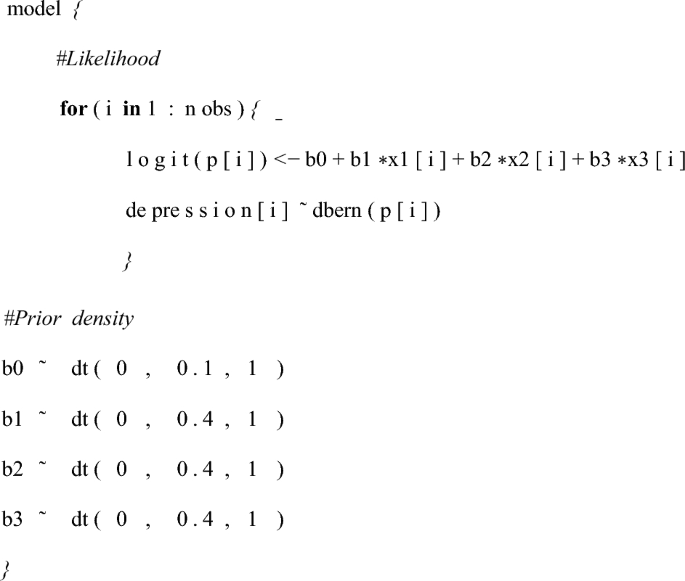
The posterior for our logistic regression model has no closed form; one cannot directly sample from it. However, it is possible to compute posterior estimates or sample from the posterior by using simulations methods such as the Markov Chain Monte Carlo (MCMC) methods (Chen et al., 2012; Gelman et al., 2013). The posterior mode can be computed using the algorithm described in Gelman et al. (2008). We use R2jags (Su et al., 2015) an R package for sampling from the posterior distribution using MCMC methods. R2jags provides wrapper functions to run Bayesian analysis in the JAGS (Just Another Gibbs Sampler) program. JAGS allows to sample from the posterior by just specifying the likelihood function and prior distribution in the form of a script. The code bellow illustrates how one can implement logistic regression models in JAGS using our prior specifications.
For each model considered in the next section, we ran three independent MCMC chains with 25,000 iterations and 5000 burn-in iterations. We set this iteration number because all MCMC chains converged well (convergence plots not provided) and we did not see any significant improvement in our posterior estimates by increasing it.
4 Results and discussion
Our results showed how households ranked the relative impact power outages had on their daily lives, their willingness to pay for more reliable energy, their mitigation strategies and how these and their characteristics interacted with one another.
4.1 Descriptive results
4.1.1 Most commonly cited costs incurred from ZESCO’s outages for individuals
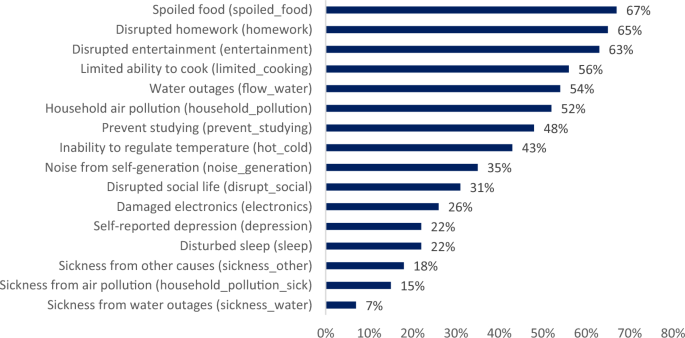
Respondents were asked to rank the various ways in which power outages imposed costs to them on a scale of 0–4, with 0 ranking as “does not cause” and 4 as “causes all the time”.Footnote1 These costs are listed below in Fig. 3. Spoiled food ranked as the highest cost of power outages for individuals in the December 2019 survey, with an average score of 2.7 out of 4 for every respondent, as shown below in Fig. 3. An option not written into the questionnaire but which scored on average almost 1 per respondent was ‘sickness from other causes’, other than from household pollution (such as from biogas cooking stoves) and other than from non-running water. Several respondents wrote in to clarify that the sickness was from diarrhoea from spoiled food.
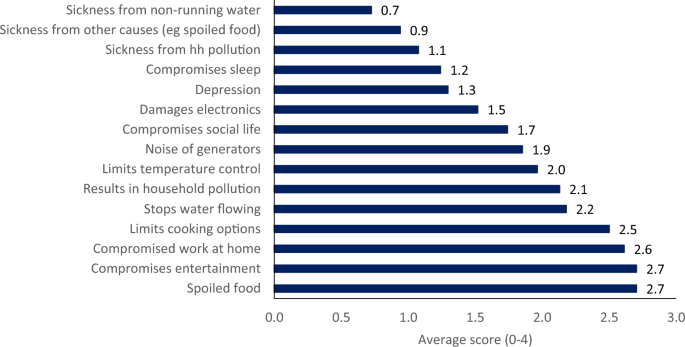
Compromised entertainment, ability to work at home, limited cooking options (from use of electric stoves and microwaves), the stopping of flowing water, household pollution and the limiting of temperature control all ranked 2 points out of 4 on average for every respondent. Depression ranked as 1.3 on average for every respondent, sickness from household air pollution cause by power outages scored on average 1.1, sickness from non-running water 0.7 and from other causes (with two respondents writing in diarrhoea caused by spoiled food) 0.9.
Analysing the extent of severity in another way, we looked at what percentage of responses ranked costs level 4 “cause all the time” and 3 “cause to a major degree”, shown below in Fig. 4. Again, spoiled food topped the chart and disruption of home-based work and disruption of entertainment were ranked as top three inconveniences. Fifty-four percent (54%) of respondents ranked sickness from water flowing stopping at 3 or 4 points, i.e. “to a major degree” or “all the time”. Twenty-two percent (22%) of respondents ranked depression at 3 or 4 points, i.e. “to a major degree” or “all the time”, and connected to that, 56% of respondents rated limited cooking and 43% of respondents rated inability to control temperature as caused to a major degree or all of the time.
Respondents also had an option to write-in their complaints or provide further insights. Five respondents wrote in that power outages adversely impacted business: they cited lost customers, lost jobs, ‘killing businesses’, affecting productivity. Two respondents who selected ‘other sickness’ explained that it was caused by food poisoning from food not properly refrigerated. Two respondents wrote in theft caused by blackouts at night. One respondent wrote accidents and fire.
Thanks to the written comments, many of the links between power outages and common complaints were well explained. For example, spoiled food is caused by refrigerators losing power, as one respondent explicitly wrote.Footnote2 Compromised entertainment is caused by loss of internet and electric appliances, as another respondent wrote.Footnote3 Compromised ability to work at home was affected by loss of internet and electric appliances, as another respondent wrote.Footnote4 Similarly, the provenance of several sicknesses caused by power outages was included within the question.
4.1.2 Ranking the use of mitigation strategies used by individuals
Respondents were asked to rank the extent to which they used mitigation strategies on a scale of 0–4, with 0 ranking as “never” and 4 as “all the time”.Footnote5 The various coping strategies and the extent to which they were used on average is listed below in Fig. 5.
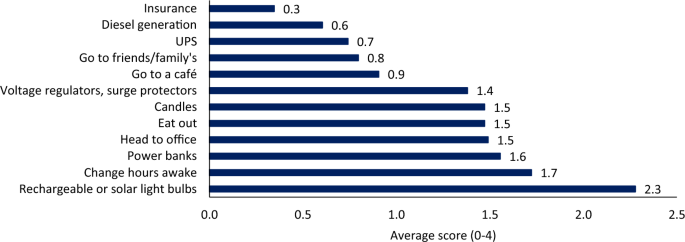
All respondents that reported using rechargeable or solar light bulbs scored their usage as 2 or above, making this the most popular mitigation strategy. The second most popular intervention was changing the hours that people were awake. The third most popular intervention was using power banks for mobile phones and fourth most popular interventions were using candles or leaving the house, either to eat out or to work.
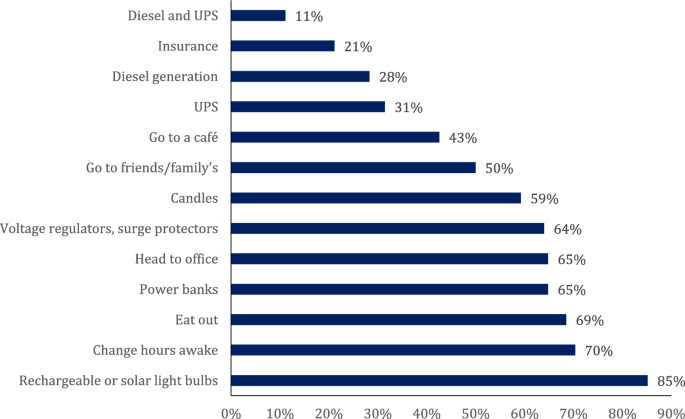
Looking at what percentage of people who responded to mitigation strategies showed the proportion of respondents who adopted strategies, as shown in Fig. 6. The top five coping strategies in Fig. 5 were the same as in Fig. 6. Sixty-four percent (64%) of respondents used voltage regulators or surge protectors to help protect their electric equipment from damage from poor quality electricity. Forty-eight percent (48%) of respondents used either or both of an Uninterruptible Power Supply (UPS) system or a diesel generator: 31% used a UPS, 28% used a diesel generator, 11% used both. Twenty-one percent (21%) of respondents used insurance for their equipment.
Respondents also had an option to write-in their coping mechanisms. Eight respondents wrote that they did not rely on electricity to cook. Of these, four wrote that they used gas stoves, three wrote that they used charcoal to cook and one wrote that they used a solar stove. One respondent wrote that when their water ran out because of an inability to pump water into their water tank when there was no power, they would ask neighbours for water.
4.2 Bayesian inference results
Table 3 in the Appendix presents the variables of interest for the Bayesian analysis results. Table 4 in the Appendix shows the number of observations for the variables, their means and ranges and their correlations with one another.
The correlation matrix shows several noteworthy results:
- There is an almost perfect correlation between the extent to which users used diesel generators and the degree to which they used UPS (uninterrupted power supply) apparatuses.
- There is a high degree of correlation between complaining of sickness from household air pollution and sickness from interrupted water flow or from some other cause, and between sickness from interrupted water flow and from some other cause.
- The greater a person’s age or household monthly income, the less likely they are to complain about the damage caused by power outages.
- Higher household income is correlated with a higher willingness to pay for reliable electricity supply.
The correlation matrix also highlights possible sources of multicollinearity for the regression models of interest, and so suggests which independent variables should not be included on the right-hand side at the same time as collinear independent variables. As discussed in Sect. 3, we aimed to learn what the relevant predictors of willingness to pay for a higher tariff were; what confounding factors were associated with self-reported depression; and what coping strategies to power outages were associated with household air pollution. Bearing in mind this multicollinearity analysis, the models we wanted to test were as follows:
- For the regression of predictors of willingness to pay, we would be able to run salary band, age and number of people in a household together since these independent variables were not highly correlated (10% between number of people in the household and age, – 24% with household income, and 25% between household income and age).
- For the regression on factors associated with self-reported depression resulting from power outages, we would be able to run inability to control one’s ambient temperature due to power outages at the same time as limited cooking since these independent variables were only 34% correlated.
- For the regression on factors associated with household air pollution, we would not be able to run a regression of household air pollution on the independent variables of limited cooking options and use of candles at the same time since these were 44% correlated.
4.2.1 Willingness to pay more to avoid power outages
We wanted to know what respondents would be willing to pay to avoid power outages: this would assign a monetary value to the various types of costs they reported experiencing.
We asked the question about willingness to pay after respondents had told us about the damages caused by power outages, reminded respondents of the costs of self-generating electricity and explained that higher tariffs would help enable greater system sustainability. We also anchored respondents’ responses with three suggestionsFootnote6 before offering them the option to write in a value for themselves. Box 1 illustrates how we did this. This framing and anchoring is commonly used in eliciting contingent valuation to overcome cognitive biases and cognitive lapses (World Bank, 2015).
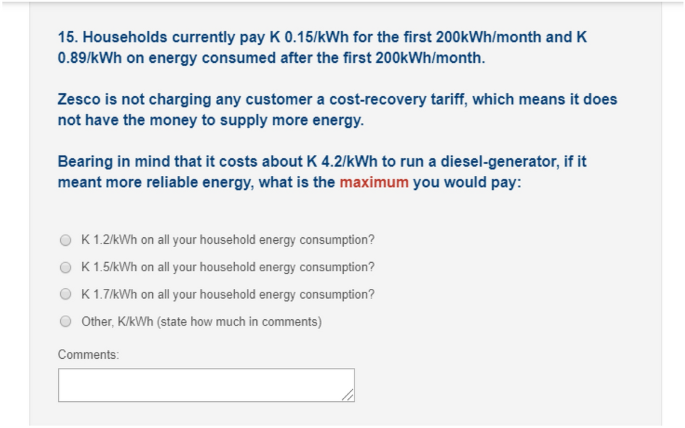
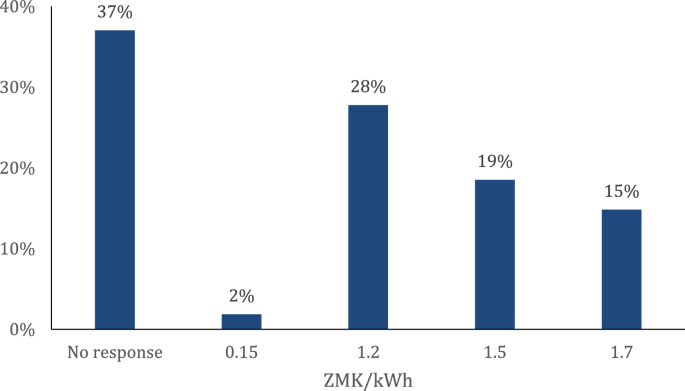
Sixty-three percent of householders said that they would be willing to pay more, see Fig. 7, which shows that most of these households would pay ZMK 1.2/kWh, followed by ZMK 1.5/kWh followed by ZMK 1.7/kWh (ZMK values as of December 2019). The mean average of those who provided an answer to maximum willingness to pay was K 1.38/kWh, c.USD 0.095/kWh (as of December 2019) – an amount near the USD 0.10/kWh mark, which according to a source is approximately ZESCO’s estimated cost-recovery tariff for new independent power projects. One respondent wrote in their own value: ZMK 0.15/kWh, which represented what they paid for the first 200 kWh of electricity consumption per month. For those who did not enter a maximum willingness to pay value, we imputed a value of ZMK 0.331/kWh because this was the effective rate an average Zambian household paid in December 2020.Footnote7
We removed from our data the responses of the two people who reported that they were not responsible for paying electricity bills in their households. In regression analysis, these two datapoints would not be helpful, and they would bias descriptive statistical results. To give ourselves an initial steer on the priors, we inferred values stated in Table 5 in the Appendix for mean averages for the three independent variables of interest.
Table 1 shows the results we deduced from our Bayesian inference. The values presented in the mean column are the posterior mean estimates of the regression coefficients which we can interpret as log odd ratios. The 95% lower and 95% upper columns are the 95% credible intervals (and the same for 90% lower and upper columns). If the interval includes zero, then the effect for that variable is not statistically significant, but otherwise it is.Table 1 Model of the predictors of the maximum value that respondents said they would be willing to pay for reliable electricity
Through sensitivity analysis, we aimed at evaluating the impact of different prior scale values on the posterior in each of the models that were considered. To do this, we kept the prior locations to zero and varied the scale value from a grid starting from 2.5 to 40 with a 2.5 step which amounts to 16 values. The standard scale suggested in the literature is 2.5 which is a highly informative prior compared to the scale of 40. For each scale value, we report the posterior mean estimate and the 95% credible interval. Figure 8 below shows that the posteriors for Table 1 above are robust. The posterior mean and the 95% credible interval do not vary much as the prior scale increases.
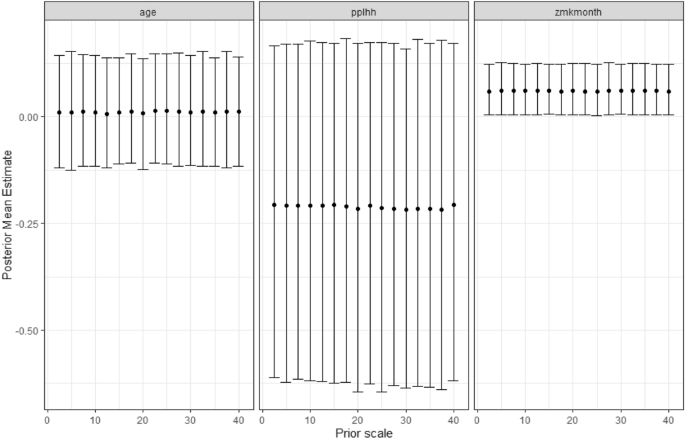
Like Meles (2020), we found that monthly income has a positive effect on the willingness to pay and it is statistically significant at the 5% level. Unlike with Meles and Abdullah and Mariel (2010), our model did not show that age or larger households were predictors of willingness to pay. The findings support utility Carlsson and Martinsson (2008)’s utility function to be a function of income.
In response to the open-ended question about how respondents would consume energy differently if the tariff was increased to ZMK 1.5/kWh, respondents said that they would use their geysers less, switch to gas stoves, use energy saving lights and have people shower within 2 h periods in the morning and evening to use their boilers less.
4.2.2 Predictors of perceived depression
Recall that in Fig. 4, 22% of respondents answered that they experienced depression to a major degree or all of the time due to power outages. Four of these respondents wrote in comments providing further colour:
- ‘Power outages have had a debilitating effect on personal wellbeing’
- ‘Communication becomes less because most of the time phones are not charged to full capacity’
- ‘I cannot use the internet during the outages. No other activities during the outage’
- ‘Stressful and expensive buying Charcoal for cooking. Promoting deforestation and affecting climate change’.
The second and third responses linked to loss of internet and thus communication were factors that we had not anticipated. The fourth response triangulated with one of the hypotheses we wanted to test, i.e. using limited cooking as independent variables to predict self-reported depression. On its own as a variable, limited cooking was significant at the 5% level – see Table 2 model ‘depression3’. When interacted with other variables that were also significant at the 5% level, however, it was not. These variables were the extent to which sleep was disturbed (‘sleep’) and sickness arising other than from air pollution or non-running water (‘sickness_other’. Looking back at our correlation matrix of variables of interest in Table 3 in the Appendix, we see that ‘limited_cooking’ is 43% correlated with ‘sleep’, suggesting that multicollinearity may account for this lack of observational effect in model ‘depression5’ below. Studies that manage to collect larger sample sizes and run more robust statistical tests can study this further. It is worth investigating this further given that the literature does find cooking to be therapeutic and has positive influences on socialisation, self-esteem and general quality of life (Farmer et al., 2018) as well as important to combating malnourishment and geriatric depression (Alam et al., 2021; Mantzorou et al., 2020).Table 2 Factors associated with self-reported depression
Only a disturbance in sleep patterns was significant at 5% levels when interacting with ‘limited_cooking’ and ‘sickness_other’. It is worth noting that the deviance information criterion (DIC) in the last row of Table 2 (which is a measure for comparing models, where the model with lowest DIC is most preferable) is lowest for the model ‘depression5’, where ‘sleep’ is included as a variable, alongside ‘sickness_other’ and ‘limited_cooking’. The next lowest value for DIC is the model ‘depression2’, where the only predictor is ‘sleep’. The null hypothesis that sleep is not associated with self-reported depression can thus be rebutted. This accords with the literature (Roberts & Duong, 2014; Wirz-Justice & Van Den Hoofdakker, 1999) that sleep deprivation can predict depression. ‘Sickness_other’ was significant at the 10% level. Our data did not show that the effects of temperature had any predictive effects on self-reported depression.
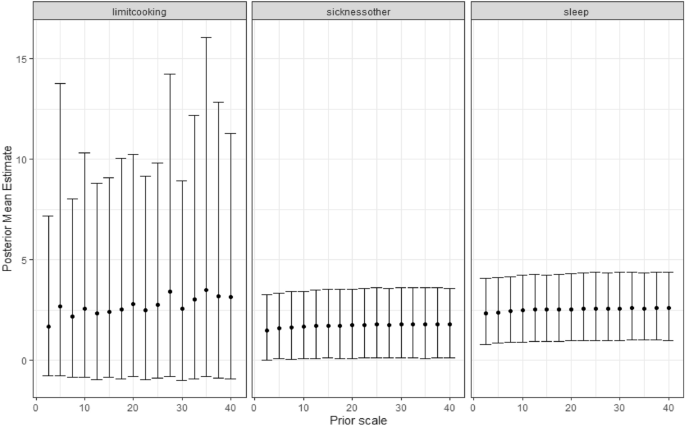
Pertaining to the posteriors for Table 2 above, Fig. 9 below shows that there is almost no variation in the marginal posterior (posterior for individual parameter) estimates for ‘sleep’ and for ‘sickness_other’ (Sickness caused other than by household air pollution or non-running water). There is for ‘limitcooking’, which has the highest uncertainty (reflected by the width of the 95% credible interval). The posterior mean for ‘limitcooking’ fluctuates around 2.5, however the conclusion about its statistical significance remains the same regardless of the prior choice since all 95% credible intervals include zero.
5 Conclusion and policy implications
The scoring of costs of power outages breaks new ground in the literature by linking power outages with self-reported depression. It also breaks new ground in identifying linking factors between outages and self-reported depression. The scoring of mitigation strategies by households in a developing world context similarly breaks new ground in the literature.
A significant proportion of respondents said that they would be willing to pay more for reliable electricity, likely enabled by our framing and anchoring, but also an expected result given that respondents responded in the midst of severe power outages, and not afterwards. Like previous literature, we found that monthly household income was a significant predictor of willingness to pay more.
Our research suggests that, at the very least, a portion of household consumers with internet connections in Zambia are willing to pay well above what the Zambian system of provision thinks it can charge them, so long as it then delivers more reliable electricity provision. The willingness to pay shows that 63% of our sample of ZESCO household customers were willing to pay more than the revised tariffs of 1st January 2020.Footnote8 If a household consumed 265 kWh in a month (as the average ZESCO household customer did in December 2020), its effective tariff would be ZMK 0.70/kWh, i.e. half of what the 63% of all respondents who stated a value that they would be willing to pay would be willing to pay. In order for the cost of household consumption under the new tariff regime to equal the willingness to pay tariff we found for 63% of respondents, households would have to consume 650 kWh of energy in a month.Footnote9
Respondents’ self-volunteered behavioural changes with hypothetical higher tariffs of ZMK 1.5/kWh (such as use their geysers less, switch to gas stoves, use energy saving lights and have people shower within 2 h periods to reduce usage of their boilers) also suggested that household consumers could be more energy efficient but were not yet incentivised to be because of low tariffs. More efficient consumption would reduce peak loads on Zambia’s electrical systems and could result in fewer power outages as it has been found to be the case by Carranza and Meeks in the Kyrgyz Republic (Carranza & Meeks, 2021).
We are of the opinion that when almost two-thirds of the population are without grid electricity (ZICTA & CSO, 2018), it does not make sense for the Zambian power utility to be subsidising any household customer’s grid electricity tariff from a distributional equity perspective. Zambia requires extra power generation capacity to meet existing and future demand, but ZESCO has been constrained in its ability to expand capacity because it has charged historically low tariffs (Ahmed, 2021a; Haria & Ahmed, 2020). We therefore recommend that the Zambian power utility be empowered to charge flat cost-recovery tariffs to all consumers who are privileged enough to be connected to the electricity grid. When ZESCO is enabled to deliver more reliably because it is adequately financed to pay for extra power generation capacity and the required maintenance, it will incentivise more efficient electricity use which will help reduce losses and it will avoid the welfare losses to its existing customer base which include physical and mental health costs, among other costs.
In light of the increased incidence of working from home following the COVID19 pandemic, the inability to work from home due to power outages has also assumed a new level of importance worldwide. Policymakers in hydropower dependant nations will do well to pay heed to Zambia’s case. With an increased likelihood of droughts, policymakers will have to increasingly contend with either the costs to householders’ mental and physical health as well as the loss of productivity for those who work at home, or the costs of avoiding load-shedding.
